
Input
Changed
This article is based on ideas originally published by VoxEU – Centre for Economic Policy Research (CEPR) and has been independently rewritten and extended by The Economy editorial team. While inspired by the original analysis, the content presented here reflects a broader interpretation and additional commentary. The views expressed do not necessarily represent those of VoxEU or CEPR.
Europe’s customs archives from 2023 reveal a record €461 billion in high-tech goods shipped outside its borders, but also a persistent €17 billion external deficit in the products that will shape tomorrow’s economy. Patent filings, venture capital flows, and intangible asset spending all indicate a different reality: the European Union today creates barely a fifth of the world’s front-tier inventions. It invests scarcely two-thirds as much in knowledge creation as the United States. The time to replace the flawed Balassa index of Revealed Comparative Advantage (RCA) with metrics that track technological capability is now. Failure to do so could result in a forthcoming EU-US trade agreement relegating Europe to the lower rungs of the next industrial order.

Exports Are Only Skin-Deep: The Mirage of Apparent Competitiveness
European policy debates still lean on the logic that if a sector exports a lot, it must be strong. By that logic, a €198 billion goods surplus with the United States in 2024 and high-tech exports equal to 18% of all extra-EU sales appear like triumphs. But export tallies are rear-view mirrors that capture momentum more than mastery. Supply-chain inertia, exchange-rate shifts, and intra-firm transfer pricing can sustain shipments for an extended period after key ideas, patents, or critical software architectures have been transferred abroad. Ben Shepherd’s decomposition of the Balassa formulation shows that as much as 40% of a one-point rise in RCA can be attributed to a competitor’s exit or currency depreciation rather than to any internal productivity gain. When analysts at CEPR matched RCA scores against patent-weighted advantage across 120 four-digit product codes, barely half of the supposed “European specializations” remained, scarcely better than a coin toss. In short, exports tell us what leaves Antwerp and Rotterdam, not why those goods exist in the first place or who owns the algorithm that drives them.
Three Structural Distortions Inside the Balassa Index
The RCA’s elegance – a product’s share in a country’s exports divided by its share in world exports – hides three embedded biases. First, persistent trade surpluses in capital-intensive sectors inflate the numerator more rapidly than the denominator, mechanically inflating the index for economies such as Germany or the Netherlands. Second, because the metric is bounded only at zero, variance explodes for small member states or tax-distorted hubs, rendering Baltic or Irish readings practically meaningless. Third and most damaging for twenty-first-century policy, the formula ignores intangible flows. A Bavarian factory shipping MRI scanners is recognized as a European champion, despite the imaging software being licensed from Boston and the superconducting coils being patented in Tokyo. OECD trade-in-value-added tables show that 29 % of Europe’s 2024 high-tech exports now embody non-EU intellectual property, up from 18 % a decade ago – proof that market share can mask technological dependence.
Quantifying the Gap: Patents, R&D, and Intangible Capital
Turn from customs windows to patent offices, and the picture sharpens. OECD Triadic counts for 2023 place the EU-27 at 22% of world frontier inventions, the United States at 31%, and China at 27%.
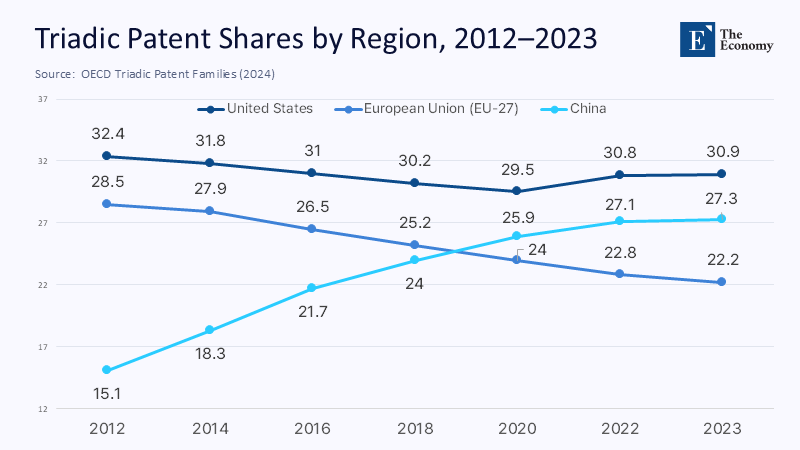
The gap is widening: ten years ago, Europe and the United States were roughly on par. R&D intensity follows suit. Eurostat reports that the Union's rate was 2.22% of GDP in 2023, essentially flat for five years; the National Science Foundation puts the United States' rate at 3.4%. Intangible investment compounds the divergence. WIPO’s latest survey reports that knowledge-asset spending exceeds 16% of GDP in highly intangible economies, such as Sweden, France, and the United States, versus an EU median of nearly 11%. Because intangibles generate network externalities – platform effects, embedded ecosystems, brand premiums – each percentage-point lag today snowballs into future productivity loss.
Complexity and Embedded IP: Europe’s Place in the Invisible Ladder
Complexity economics offers another vantage point. The Harvard Growth-Lab index shows South Korea, Japan, and Switzerland pulling ahead of the EU average in productive know-how, while Europe’s internal distribution is uneven: Germany remains the world’s fourth most complex producer, but Spain, Poland, and Greece sit below the global median. This matters because economic complexity, a measure of the diversity and sophistication of a region's productive know-how, predicts not volume but optionality. An area that exports a narrow band of sophisticated goods, reliant on foreign patents, is vulnerable to external shocks – a lesson driven home when the 2024 US export control updates on AI chips forced several German fabless designers to suspend shipments. Eurostat data reveal that 44 % of Europe’s nominal “semiconductor” exports now leave the continent as intermediate products to be finished in East Asia, illustrating how embedded IP dictates where margins accrue.
The Trans-Atlantic Negotiation Trap: Tariffs versus Technology
Caution in Decision-Making: These structural weaknesses collide with geopolitics. Since the revival of the EU-US Trade and Technology Council, Brussels hopes to close a tariff-cutting deal on clean-tech machinery, digital services, and medical devices before Washington’s July deadline. Yet tariffs are already low; the real border is regulation and embedded IP. US digital giants have absorbed €6.7 billion in EU competition fines since 2018 – a de facto tariff that may disappear if concessions are made in exchange for headline market access. With export figures inflated by assembly-stage sales, Europe could concede tariff symmetry in sectors where US firms supply the patents and software layers, thereby accelerating the hollowing out of upstream research. Reuters warns that EU leaders are under pressure to accept a quick deal to avoid Trump’s 50% tariff threat, even though such a concession would remove Europe’s main bargaining chip without addressing its innovation shortfall. History counsels caution: tariff liberalizations signed on obsolete metrics lock in structures long after spreadsheets have been updated.
Misreading Metrics: Lessons from Chile-China and Morocco-US FTAs
Learning from Past Mistakes: RCA Myopia Is Not Just a European Failure. Chile's 2006 FTA with China, boasting a 2.1 Balassa score in processed wood and paper, is a cautionary tale. Within three years, Chinese firms had captured half the market by leveraging superior pulp chemistry patents, and Chilean output declined by 14%. A similar story unfolded for Morocco’s 2004 accord with Washington: RCA pointed to textile strength, but once quotas vanished, US fast-fashion brands shifted orders to Asia, and Moroccan apparel exports to the US dropped 34% while the bilateral deficit doubled. The common thread is the miscalculation of true capability: negotiators relied on trade shares rather than on learning curves, patent portfolios, and financing depth. Europe now has the opportunity to learn from these mistakes and avoid repeating them on a continental scale.
Toward Smarter Metrics: Patent-Weighted RCA and Pipeline Dashboards
Fixing the mirror requires two analytical upgrades. First, patent-weighted RCA multiplies each product’s export share by the ratio of domestic to global patents in its underlying IPC classes. Applied to 2024 data, this hybrid flips Europe’s supposed edge in battery cathode materials from positive (0.43) to negative (-0.27) and halves its perceived advantage in precision optics.
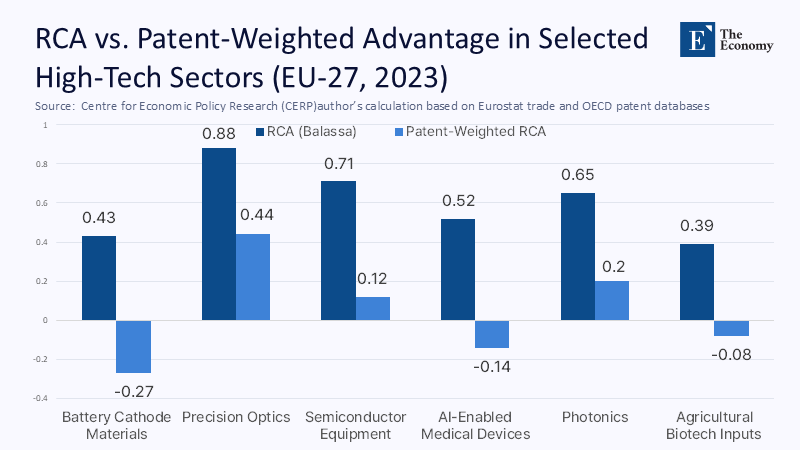
The correlation with total factor productivity jumps from 0.55 to 0.84 in CEPR’s test sample. Second, negotiators need scenario dashboards that link tariff staging to R&D pipelines: If European entities file fewer than 15 of the global next-gen semiconductor patents, reciprocity in that segment should be phased in only alongside joint research offsets or IP-sharing commitments. The Commission’s 2025 Competitiveness Compass already aggregates startup and scale-up data; extending it with live patent-family feeds would turn it from a scorecard into a negotiation instrument.
Internal Levers: Compress Fragmentation, Fund Scale, Reward Ideas
Even perfect metrics accomplish nothing if the underlying inputs stay anemic. R&D spending remains below the Lisbon-era 3% target in two-thirds of member states, while venture capital markets are fragmenting along regulatory borders. Dealroom counts €92 billion in VC raised across Europe in 2023, with more than half landing in Germany and the Netherlands; the southern and eastern ecosystems, however, rely disproportionately on US funds. By contrast, US startups attracted roughly $345 billion in the same year. The EU’s proposed Capital Markets Union and the Competitiveness Fund can narrow this gap if they focus on scale-sensitive platforms, such as AI computing, advanced biotech, and photonics, rather than scattering resources through hundreds of micro-calls. Regulation must also evolve from punitive to enabling: shifting some digital services tax revenue into challenge prizes for EU-based cloud or battery chemistry R&D would turn fines into a source of innovation. Finally, customs rules should recognize “idea-based” origin, counting embedded R&D rather than assembly location. The OECD already collects the necessary data, and aligning tariff schedules with intellectual property would reward genuine European innovation.
Strategic Autonomy Re-Defined: From Tariff Walls to Knowledge Networks
Brussels often frames “open strategic autonomy” in terms of tariff flexibility and diversified sourcing of critical inputs. Yet the logic of intangible-heavy sectors is that power lies upstream in design and standards. The Union cannot hope to out-subsidize the US Inflation Reduction Act or China’s directed credit machine, but it can hard-wire markets to favor firms that develop IP on European soil. Public procurement clauses that award extra weight for domestic patent ownership, coupled with fast-track visa regimes for STEM talent, would shift the center of gravity without violating WTO non-discrimination (intellectual location is a performance criterion, not a nationality test). Meanwhile, feeding richer, complexity-weighted data into Horizon Europe, calls would help panels identify projects able to bootstrap entire value-chain clusters rather than isolated prototypes. What matters is to move from managing yesterday’s trade flows to orchestrating tomorrow’s knowledge graphs.
Negotiating with Eyes Wide Open
Europe’s export numbers still shimmer, but they shimmer like dusk sunlight – brilliant just before night. The Balassa index, forged in an era of container ships and linear value chains, blinds policymakers to the unseen currents of ideas, code, and capital that now determine prosperity. Adopting smarter, patent-aware metrics will not automatically close the innovation gap, but it will illuminate it. If Brussels enters the next trans-Atlantic bargain armed only with the comfort of a flattering mirror, it may discover too late that the mirror was one-way glass. A trade deal concluded based on outdated data could lock Europe into a second-tier status for a generation; an agreement negotiated on evidence could give the continent the leverage – and the urgency – to rebuild its technological base. Europe must choose quickly whether to admire itself or to understand itself.
The original article was authored by Filippo Di Mauro, a Founder and Chairman at CompNet, along with two co-authors. The English version of the article, titled "Export strength does not equal tech strength: Rethinking EU comparative advantage," was published by CEPR on VoxEU.
References
Ben Shepherd. (2021). How Misleading is Revealed Comparative Advantage? Working Paper DTC-2021-2, Developing Trade Consultants.
CEPR. (2025). Export strength does not equal tech strength: Rethinking EU comparative advantage. VoxEU.
Dealroom.co. (2023). European tech ascendancy: The 100× continent.
European Commission. (2025). A Competitiveness Compass for the EU. SWD(2025) 138.
Eurostat. (2024a). International trade and production of high-tech products.
Eurostat. (2024b). R&D expenditure – Statistics Explained.
Harvard Growth Lab. (2025). Country & Product Complexity Rankings.
National Science Foundation. (2025). Research and Development: US trends and international comparisons.
OECD. (2025a). Main Science and Technology Indicators, March 2025.
OECD. (2025b). Triadic patent families.
PitchBook-NVCA. (2024). Q4 2023 Venture Monitor First Look.
Reuters. (2025a). EU to canvass leaders at summit on resolving US tariff conflict.
Reuters. (2025b). EU points way to competitive future to catch US, China rivals.
World Intellectual Property Organization. (2024). World Intangible Investment Highlights: Better Data for Better Policy.